A Picture Is Worth A Thousand Words. Video Even More
Introduction
Complex, multi-event scenarios can be conveyed more effectively by a single still image, and adding video further clarifies telematics and GPS data, offering a clearer understanding than a written report.
As telematics data used as evidence in both criminal and insurance cases becomes more complex, with data available from multiple sources, the need to convey the results of any data analysis clearly and concisely is greater.
Data may be available from vehicle onboard units such as satnavs, Event Data Recorders, Air Bag Modules, and vehicle tracking units. It is vital that the results of any data analysis can be presented to the court in a manner that highlights key analysis conclusions without scope for misunderstanding.
Static Map Images
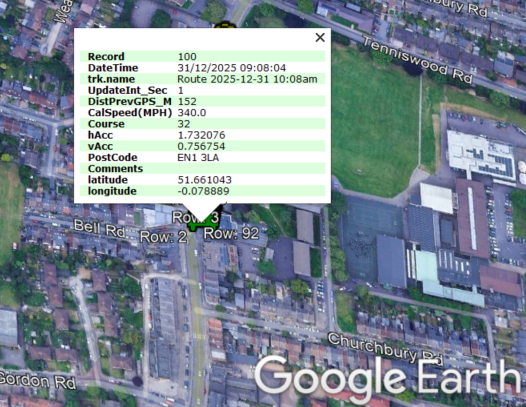
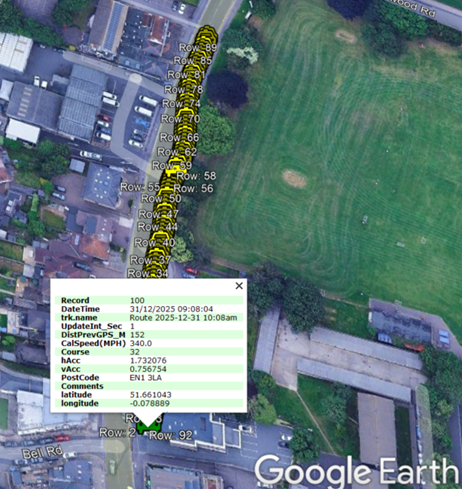
Typical expert witness reports include static images of maps with icons representing events of interest. For example, an icon representing latitude & longitude, with date/time values depicting the location of a vehicle or mobile phone.
These images are also expanded to show multiple icons, each with a data/time and an associated value, such as speed or acceleration/deceleration values along a route, for example, the 10 seconds before a collision.
Benefits of Interactive Presentations
The creation of an interactive presentation will provide a clearer understanding of the event of interest by plotting it on a map at different zoom levels and with Street View images, and will include a replay of the vehicle route as a video clip.
Legal teams and insurance investigators can then use a visual representation of “raw” data to better understand a sequence of events and put the data into context.
The Court and juries can use the interactive presentation to add context to the static presentation of data and conclusions in the expert witness report, giving a better understanding of complex data.
The example video shows this through detailed map imagery and route replays.